Young families with children recognize Norwell SAT scores as some of the highest on the South Shore
Young families looking to buy a home usually have done their homework and know Norwell SAT scores are some of the best in the State. Usually, buying a home in a town is predicated upon evaluating the public school system first. Even though people might hear good things through friends and family, parents fortunately have easy access to hard data like Norwell SAT scores provided by the Commonwealth of Massachusetts Department of Elementary and Secondary Education to help make their own informed decisions.
 What people will uncover is that Norwell has consistently been one of the top performing public school districts in the State with strong MCAS results, SAT scores, and AP performance. Norwell has also been named by newspapers and magazines as a top public school system, based on its teacher to student ratio, per pupil spending, graduation rate and percentage of students taking multiple AP courses. In addition to strong Norwell SAT Scores, the school district has done a good job creating a culture of exceptional learning and thus, recruiting the best and brightest new teachers has never been a problem.
The SAT Reasoning Test assesses student reasoning based on knowledge and skills developed by the students in their course work. The SAT Subject Tests™ are a series of one-hour, mostly multiple-choice tests that measure how much students know about particular academic subject and how well they can apply that knowledge.
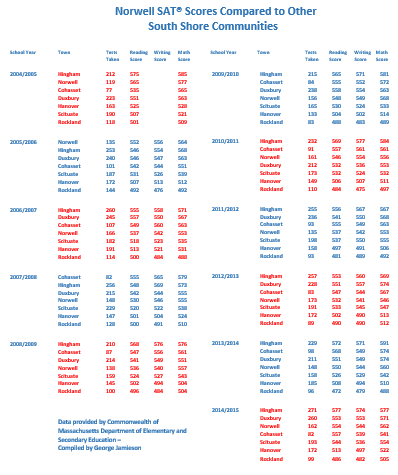
 For the last 9 years, as of 2015, Norwell SAT scores have placed College-bound test takers consistently in 4th place compared to neighboring South Shore communities, Hingham, Cohasset, Duxbury, Scituate, Hanover and Rockland. In the 2004/2005 and 2005/2006 school years, Norwell SAT test takers placed in the top one and two spots on the South Shore compared to its neighbors. Hingham has had the top spot on the South Shore for 6 of the 7 last school years as Hingham SAT test takers have performed significantly better than their neighbors.
In the last 11 years, Norwell SAT scores have had above average scores compared to statewide scores. In the 2014/2015 school year, Norwell test takers scored 544 in Reading, 545 in Writing and 559 in Math. According to College Board and test results announced by the Massachusetts Department of Elementary and Secondary Education, the average SAT score for Massachusetts public high schools was 507 in reading, 498 in writing and 523 in math. And according to College Board, the national average SAT score this year was 492 in reading, 478 in writing and 501 in math.
Norwell SAT scores is one way to assess the end product of what your children have received in terms of overall learning and application of knowledge during their K through 12 education. It is also a very important assessment tool that Colleges and Universities utilize to assess student applicants in their quest for acceptance to the schools they want to get into.
Massachusetts has touted its #1 recognition in its K-12 education system nationally and has recently continued to make strides with a healthy uptick of 7.5% in AP courses taken last year by high school students Statewide. Norwell had 343 Advanced Placement tests taken during the school year, which is another way to assess the overall quality and knowledge being applied by students.
Data provided by: The Massachusetts Department of Elementary and Secondary Education (website)
Compiled by: George Jamieson